A data visualization platform that empowers teachers to make data-based decisions about teaching strategy
Task: System Design; UX Research & Design; Prototyping
Role: Co-designer
Challenge
Enhance and enable systemic change in developing practical measures of students’ math discourse, and in working with coaches and teachers to attend to pedagogies that promote deeper math talk.
Outcome
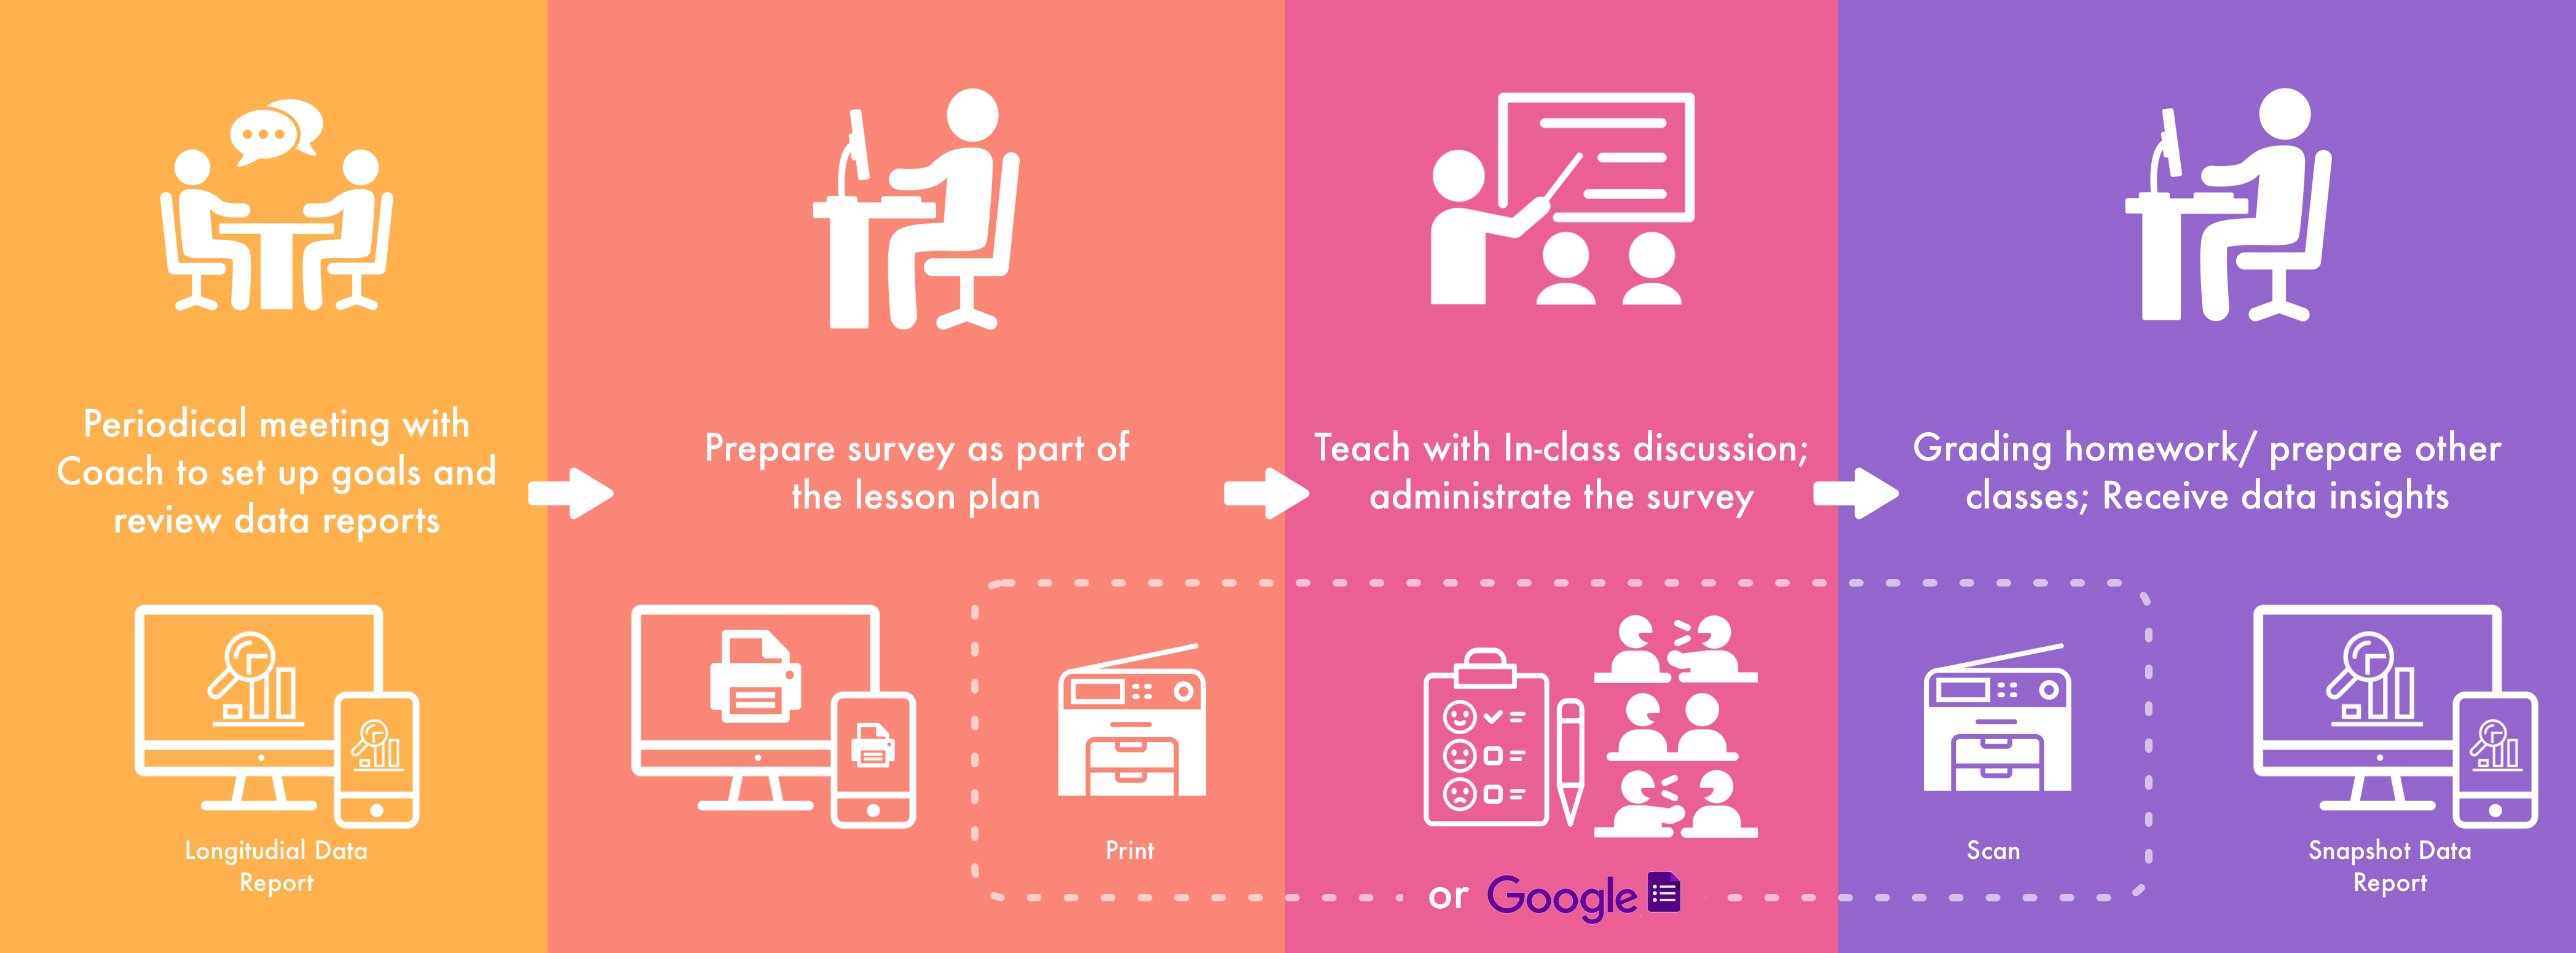
EdSight, an online platform that provides a streamlined classroom data collection practice and a data visualization dashboard with guided data interpretation for teachers to evaluate and reflect on student feedback. Funded by National Science Foundation.
Problem
Confronting customer feedback can be intimidating; understanding the related data poses another layer of difficulty. This challenge is especially salient between teachers and students. Researchers and policymakers are realizing that the educational data shouldn’t only be used within the lab by the researchers and scientists, it should also be used to empower teachers to make more informed decisions. In other words, teachers should be involved and learn to read and illustrate the data and take an active role in using the data.
How might we help teachers to understand their students better and improve their daily practice through data? How might we improve teachers’ data literacy through guided discovery via data visualization?
Design Challenges

Solution
Our research lab (the Innovatory Group) conducts design-based research to design, evaluate, and understand the role of visualizations of data culled from our Research-Practice Partnerships work, to enhance and enable the systemic change process in developing practical measures of students’ math discourse, and working with coaches and teachers to attend to pedagogies that promote deeper math talk. The MVP has already been implemented in the partnered classrooms in TN, WA, and CA since Jan 2018.


Design Process
Next Phase


Responses
No Response Found